x

Business Intelligence

Business Intelligence

Make decisions based on knowledge, visualize your data in graphs, maintain your competitive advantage and reach your goals

What does it consist of?

What does it consist of?

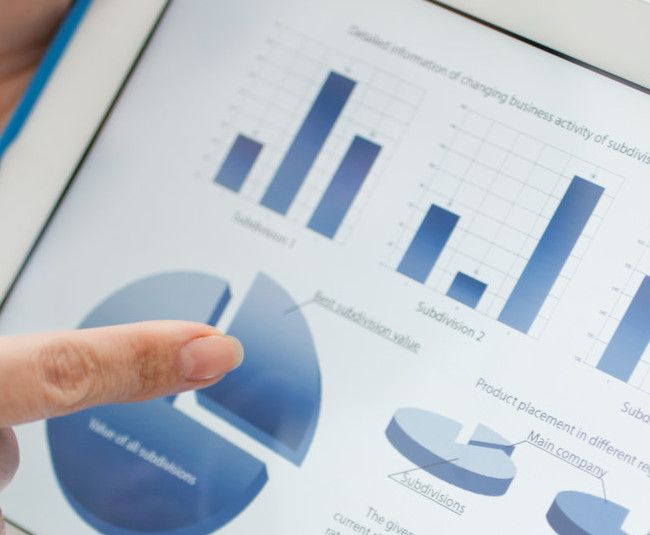
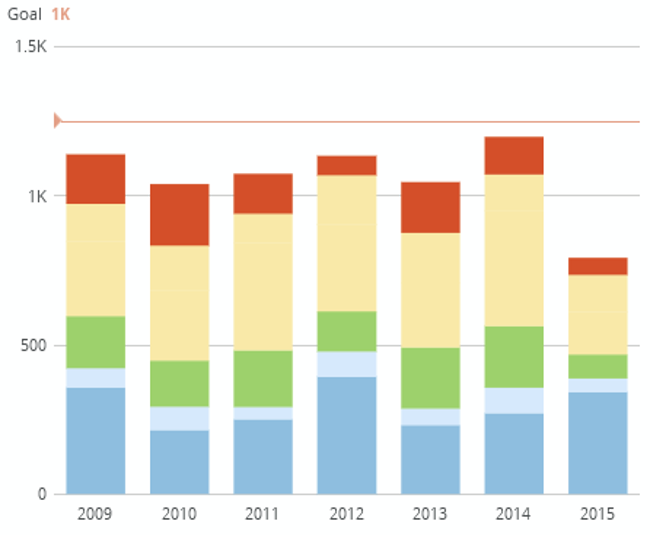
Convert the data and information generated by your company or organization into useful knowledge. Data visualization in an easy and understandable way, and its presentation in reports, scorecards, tables, graphs or interactive panels, allow you to make decisions based on the information.

How I use it?

How I use it?

A Central Data Warehouse unifies, cleans and organizes all the necessary data. Access information from the office or from anywhere in the world with Internet connection, using PC, laptop, tablet or smartphone. Control what is happening in the organization in real time as it occurs.

What benefits do I get?

What benefits do I get?

Get ahead of the competition and keep your competitive advantage. Save time and money in the management of your company. Use every day a powerful tool that helps each person in their work. It covers any need for treatment and visualization of information that you may need.

Our services

Central Data Warehouse

Store the data of your company in a unique repository, both internal information (ERP, CRM, systems of production, applications, etc.) and external information (logs of web page, traffic in social networks, public datasets, etc.).

Data Integration

Extraction, Transformation and Loading of Data in your Central Data Warehouse, from multiple sources of information. We ensure that data is valid and adequate, so that it can be related and displayed correctly in dashboards, tables and charts.

Data Quality

Adjust your data with business rules and smart filters, to detect errors and solve data quality problems. Unify formats and implement the business logic you need for your data.

Key Performance Indicators (KPIs)

KPIs serve to measure and improve your business using the appropriate Indicators that represent the performance of your company or organization. Get a global view of the actual state of your business processes using scorecards.

Interactive Reporting

Visualize your company information with Advanced Reports, to analyze what has happened, to understand why it has happened and to be able to act to improve the established results and goals.

Dashboards

Get a glimpse of key information from your organization. Would you like to know at a glance how your company, your department, your sales or your customers are performing? Discover hidden information and detect patterns about your data.

Business Intelligence projects have a high ROI, with values between 250% and 2000%.

Payback is usually quick, typically less than a year.

Internal audits show that companies consume 30% of the time of the administration and commercial teams creating reports (1.5 days a week), so automating this process entails savings of thousands of euros per year.

Business Intelligence benefits

Precise business vision

Real-time decision making

Improved sales, cost and profitability analysis

Maximizing asset performance

Segmentation and analysis of customer behavior

Capturing opportunities in sales and marketing

Personalized marketing using social information

Detection of customer loss

Fraud detection and risk quantification

Trends in the market

Planning and prediction

We call you

Just leave us your data and we will contact you shortly.

State-of-the-art technology